Audience Intelligence Service
From Social Listening to Audience Intelligence
1. Executive Product Concept
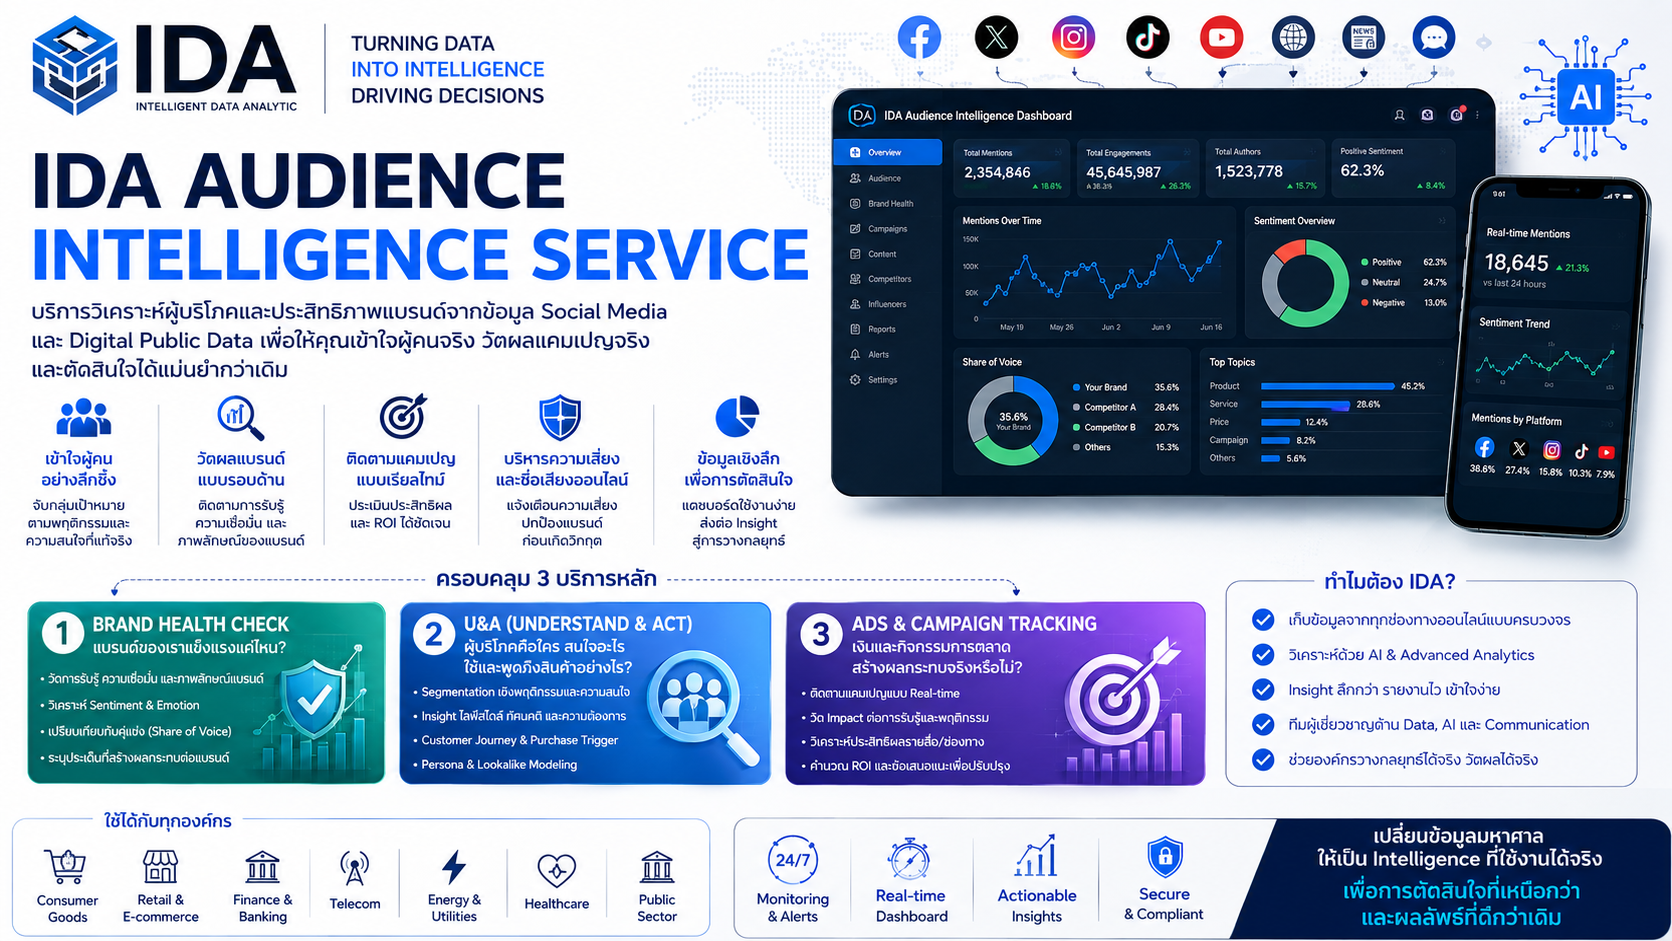
IDA Audience Intelligence คือบริการวิเคราะห์ผู้บริโภค สุขภาพแบรนด์ คู่แข่ง และผลกระทบของแคมเปญ จากข้อมูล Social Media, Digital Public Data, First-party Data ที่ลูกค้าอนุญาต และข้อมูลเสริมที่มีสิทธิ์ใช้งานอย่างถูกต้อง เพื่อเปลี่ยน Digital Signals ให้เป็นข้อมูลประกอบการตัดสินใจของผู้บริหาร
บริการออกแบบมาเพื่อตอบคำถามหลัก 3 ด้าน:
- Brand Health Check: แบรนด์แข็งแรงเพียงใด และกำลังเปลี่ยนแปลงไปในทิศทางใด
- Social U&A Intelligence: กลุ่มผู้บริโภคดิจิทัลคือใคร สนใจอะไร ใช้สินค้าในบริบทใด และมีปัจจัยเลือกหรือปฏิเสธแบรนด์อย่างไร
- Ads & Campaign Tracking: กิจกรรมการตลาดทำให้บทสนทนา การรับรู้ และความเชื่อมโยงกับแบรนด์เปลี่ยนแปลงหรือไม่
Social Listening บอกว่า “เกิดอะไรขึ้น” — IDA Audience Intelligence อธิบายต่อว่า “เกิดกับใคร เพราะอะไร และแบรนด์ควรทำอะไรต่อ”
ขอบเขตที่ต้องสื่อสารอย่างถูกต้อง
IDA Audience Intelligence ไม่ควรถูกนำเสนอว่าเป็นฐานข้อมูลประชากรไทยทั้งหมด หรือใช้ทดแทน Representative Survey โดยอัตโนมัติ ผลลัพธ์สะท้อน กลุ่มผู้ใช้และบทสนทนาดิจิทัลที่ระบบเข้าถึงได้ตามสิทธิ์ของแพลตฟอร์มและเงื่อนไขโครงการ จึงควรรายงาน Coverage, Data Quality, Bias และข้อจำกัดควบคู่กับ Insight
2. Product Positioning
Product Promise
เข้าใจว่าใครคือกลุ่มผู้บริโภคดิจิทัลของแบรนด์ พวกเขาสนใจอะไร เลือกหรือปฏิเสธแบรนด์เพราะอะไร และกิจกรรมการตลาดกำลังเปลี่ยนการสนทนาของตลาดอย่างไร
English Positioning
Turn Social Signals into Audience Intelligence. Understand who your audiences are, what drives them, how they perceive your brand, and what changes after every campaign.
ความแตกต่างจาก Social Listening Tool
| Social Listening ทั่วไป | IDA Audience Intelligence |
|---|---|
| ติดตาม Mention และ Sentiment | เชื่อม Mention กับ Audience Segment, Driver และ Business Question |
| รายงานสิ่งที่เกิดขึ้น | อธิบายสาเหตุ กลุ่มที่ได้รับผล และแนวทางดำเนินการ |
| เน้น Keyword/Channel | เน้น Audience, Brand, Category, Competitor และ Campaign |
| Dashboard เป็นผลลัพธ์หลัก | Dashboard + Analyst Interpretation + Executive Recommendation |
| KPI เชิงปริมาณ | KPI เชิงปริมาณ คุณภาพ ความเปลี่ยนแปลง และผลกระทบธุรกิจ |
3. Business Architecture: 6 Intelligence Layers
Audience Intelligence — Who are they?
วิเคราะห์กลุ่มผู้สนใจแบรนด์หรือหมวดหมู่จากพฤติกรรมและความสนใจที่สังเกตได้
Behavior Intelligence — What do they do?
วิเคราะห์รูปแบบการมีส่วนร่วม การค้นหา การสนทนา Usage Occasion และเส้นทางพฤติกรรมดิจิทัล
Interest Intelligence — What do they care about?
สร้าง Topic, Content, Creator, Category และ Lifestyle Affinity
Brand Intelligence — What do they think about us?
วัด Awareness Signals, Sentiment, Emotion, Association, Reputation และ Loyalty Signals
Competitive Intelligence — Why us or competitors?
วิเคราะห์ SOV, Audience Overlap, Differentiator, Switching Signal, Strength, Weakness และ White Space
Campaign Intelligence — What changed?
เปรียบเทียบ Pre/During/Post Campaign เพื่อประเมิน Conversation Lift, Association Shift และ Residual Effect
ทุก Layer ส่งต่อผลไปยัง Executive Decision Intelligence เพื่อสรุป Situation → Evidence → Implication → Recommendation → KPI to Monitor
4. Data Source Blueprint
4.1 Data Source Groups
| กลุ่มข้อมูล | ตัวอย่าง | แนวทางการใช้ |
| Social Public Signals | Facebook, Instagram, TikTok, YouTube, X, Threads | เฉพาะข้อมูลสาธารณะหรือข้อมูลที่ได้รับสิทธิ์ตาม API/ข้อตกลง |
| Community & Discussion | Pantip, Webboard, Forum, Blog | วิเคราะห์ Topic, Need, Pain Point, Narrative และ Usage Context |
| News & Publisher | Online News, Publisher Site | วิเคราะห์ Media Narrative, Risk และ Earned Visibility |
| Review & Commerce Signals | Review Site, Product Review, Public Marketplace Signals | วิเคราะห์ Driver, Barrier, Product Attribute และ Experience |
| Search & Trend Signals | Search Trend, Keyword Trend | ใช้เป็น Interest Proxy และตรวจ Directional Change |
| Owned Data | Brand Page, Campaign Report, Web Analytics, CRM Aggregate | ใช้เมื่อได้รับอนุญาตและกำหนดวัตถุประสงค์ชัดเจน |
| Research Data | Survey, Focus Group, Market Data | ใช้ Triangulation และ Calibrate Social Insight |
4.2 Source Governance Record
ทุกแหล่งข้อมูลต้องมี Source Register ระบุ Owner, Access Method, Legal/Contractual Basis, Allowed Fields, Retention, Refresh Frequency, Geographic Coverage, Known Bias และ Prohibited Uses
4.3 Coverage Statement
Dashboard และรายงานควรแสดงอย่างน้อย:
- แพลตฟอร์มและช่วงเวลาที่ครอบคลุม
- จำนวน Content/Author ที่วิเคราะห์หลังคัดกรอง
- สัดส่วนข้อมูลที่จำแนกภาษาและ Sentiment ได้
- Missing Data หรือ Platform Limitation
- Methodology Change Log
- ระดับความเชื่อมั่นของ Insight
5. Logical Data Model
Core Entities
| Entity | Field สำคัญ |
| Content | Content ID, Source, Timestamp, Text/Media Feature, URL/Reference, Engagement |
| Author Signal | Pseudonymous ID, Observable Interest, Channel Activity, Public/Permission Status |
| Brand | Brand, Product, Sub-brand, Attribute, Association |
| Topic | Category, Theme, Need, Pain Point, Usage Occasion, Driver, Barrier |
| Audience Segment | Segment ID, Definition, Inclusion Rule, Size Signal, Confidence |
| Campaign | Campaign ID, Objective, Period, Creative, Channel, KOL, Hashtag |
| Competitor | Competitor ID, Category, Comparison Dimension |
| Risk Event | Issue, Severity, Velocity, Source Diversity, Potential Impact |
| Insight | Finding, Evidence, Confidence, Implication, Recommendation, Owner |
Identity-safe Design
- ใช้ Pseudonymous Identifier แทนการสร้างโปรไฟล์บุคคลโดยไม่จำเป็น
- วิเคราะห์และส่งมอบในระดับ Aggregate เป็นค่าเริ่มต้น
- ไม่อนุมาน Sensitive Personal Data จากข้อความหรือพฤติกรรม เว้นแต่มีความจำเป็น ฐานกฎหมาย และมาตรการเหมาะสม
- Demographic Attribute ใช้เฉพาะเมื่อแหล่งข้อมูลอนุญาต มีคุณภาพเพียงพอ และรายงานระดับ Confidence
- ห้ามรวมข้อมูลข้ามแหล่งเพื่อระบุตัวบุคคลโดยไม่มีวัตถุประสงค์และอำนาจที่ชัดเจน
6. Audience Segmentation Model
6.1 Segmentation Dimensions
- Need State: ต้องการความคุ้มค่า ความสะดวก คุณภาพ ความมั่นใจ สถานะ หรือประสบการณ์
- Behavior: Engagement, Advocacy, Complaint, Search, Review, Consideration และ Switching
- Interest: Lifestyle, Creator, Content, Category และ Adjacent Interest
- Attitude: Positive, Skeptical, Loyal, Deal-driven, Innovation-seeking หรือ Risk-sensitive
- Usage Context: Home, Work, Travel, Exercise, Family, Festival หรือ Emergency
- Brand Relationship: Prospect, New User, Existing User Signal, Loyalist, Lapsed/Switching Signal และ Detractor
6.2 Segment Output
แต่ละ Segment ต้องมี:
- Segment Definition และ Inclusion Logic
- Estimated Digital Size Signal ไม่เรียกว่า Population Size หากไม่ได้ Weighting แบบ Representative
- Persona และ Need State
- Interest Graph และ Content Affinity
- Brand/Competitor Affinity
- Channel และ Creator Affinity
- Purchase Driver, Barrier และ Trigger
- Recommended Message, Content, Offer และ Channel
- Confidence, Data Coverage และ Limitation
6.3 ตัวอย่าง Segment Library
Value Maximizers, Premium Experience Seekers, Convenience First, Trend Explorers, Health Conscious, Tech Enthusiasts, Brand Loyalists, Skeptical Researchers และ Deal-driven Switchers
Segment ต้องสร้างจาก Evidence ของแต่ละ Category ไม่ควรใช้ชื่อสำเร็จรูปโดยไม่มีข้อมูลรองรับ
7. IDA Brand Health Index
7.1 Proposed Index
ให้คะแนน 0–100 จากองค์ประกอบที่ Normalize ตาม Category Baseline:
| Component | น้ำหนักตั้งต้น | ตัวอย่างตัวชี้วัด |
| Awareness & Visibility | 20% | Unique Authors, Mention Trend, SOV, Search Interest |
| Engagement Quality | 15% | Meaningful Engagement, Author Diversity, Conversation Depth |
| Sentiment & Emotion | 20% | Net Sentiment, Trust/Love, Anger/Concern, Severity-weighted Negative |
| Brand Association | 20% | Target Association Strength, Distinctiveness, Association Shift |
| Advocacy & Loyalty Signals | 15% | Recommendation, Repeat Advocacy, Defense of Brand, Positive Review |
| Reputation & Risk Resilience | 10% | Complaint Velocity, Negative Narrative, Recovery Speed, Risk Diversity |
7.2 Formula Concept
Brand Health Index = Σ (Normalized Component Score × Approved Weight)
น้ำหนักต้อง Calibrate ตามอุตสาหกรรมและวัตถุประสงค์ ไม่ควรใช้ Weight เดียวกับทุกแบรนด์ พร้อมแสดง:
- Current Score และ Trend
- Contribution by Component
- Benchmark vs Category/Competitor
- Confidence Level
- Major Driver of Change
- Recommended Action
7.3 Guardrails
คะแนนไม่ใช่มูลค่าแบรนด์ทางบัญชี ไม่ใช่ผล Survey Awareness โดยตรง และไม่ควรอ้างเป็นตัวแทนประชากร หากไม่มีการผสาน Survey/Panel และ Weighting ที่เหมาะสม
8. Social U&A Intelligence Model
Question Framework
| คำถาม | วิธีวิเคราะห์ | Output |
| Who are they? | Observable behavior, interest และ community signals | Audience archetype/segment |
| What interests them? | Topic, creator, category และ content affinity | Interest graph |
| What do they discuss? | Topic clustering และ narrative analysis | Conversation landscape |
| Why choose? | Driver extraction และ evidence coding | Purchase driver ranking |
| Why reject? | Barrier, complaint และ pain-point analysis | Barrier map |
| How used? | Usage occasion/context extraction | Occasion map |
| What triggers action? | Event, promotion, review, KOL และ launch linkage | Trigger pathway |
Research Triangulation
หากลูกค้าต้องการข้อสรุประดับตลาดหรือประชากร ให้เสนอ Hybrid Study:
- ใช้ Social Data สำรวจ Hypothesis และภาษาของผู้บริโภค
- ใช้ Survey ทดสอบ Prevalence และ Representation
- ใช้ CRM/Sales Aggregate ตรวจความสัมพันธ์กับผลธุรกิจ
- ใช้ Analyst Interpretation สรุปสิ่งที่สอดคล้องและขัดแย้ง
9. Ads & Campaign Measurement Framework
9.1 Measurement Design
- Pre-Campaign: กำหนด Baseline, Objective, Target Association, Audience, Competitor Activity และ Measurement Window
- During Campaign: ติดตาม Reach Signals, Conversation Lift, Engagement Velocity, Creative/Channel/KOL Performance, Audience Response, Sentiment Shift และ Topic Shift
- Post-Campaign: ประเมิน SOV Lift, Association Shift, Audience Expansion, Earned Conversation, Negative Spillover และ Residual Effect
9.2 Campaign KPI Tree
| Objective | Leading Indicator | Outcome Signal |
| Awareness | Reach Signals, Unique Authors, SOV | Sustained conversation และ search interest |
| Association | Target keyword/theme linkage | Association share ก่อน–หลัง Campaign |
| Consideration | Question, review, comparison, intent language | Positive consideration signal |
| Engagement | Velocity, meaningful interaction, creator response | Earned conversation quality |
| Reputation | Sentiment, trust, complaint theme | Risk reduction/positive narrative resilience |
9.3 Causality Language
หากไม่มี Control Group, Experiment หรือ Causal Design ให้ใช้คำว่า “สัมพันธ์กับ” “เกิดขึ้นในช่วงแคมเปญ” หรือ “Brand Lift Signal” ไม่ควรสรุปว่า Campaign เป็นสาเหตุโดยตรง หากหลักฐานรองรับเพียงความสัมพันธ์
10. Dashboard Information Architecture
1) Executive Overview
Brand Health Index, SOV, Net Sentiment, Target Association, Audience Movement, Campaign Score, Reputation Risk, Top Change Driver และ Recommended Actions
2) Audience Explorer
Segment Map, Persona, Interest Graph, Need State, Channel/Creator Affinity, Brand Affinity, Segment Trend และ Compare Segments
3) Brand Health
Awareness Signals, Sentiment/Emotion, Association, Reputation, Advocacy, Loyalty Signal, Trend และ Competitor Benchmark
4) Social U&A
Usage Occasion, Attitude, Need, Pain Point, Driver, Barrier, Trigger และ Evidence Explorer
5) Competitor Intelligence
SOV/SOE, Perception Map, Audience Overlap, Switching Signal, Differentiator, Strength/Weakness และ White Space
6) Campaign Intelligence
Pre/During/Post View, Conversation Lift, Creative/KOL/Channel Performance, Audience Response, Association Shift และ Residual Effect
7) Content & Influencer Intelligence
Content Theme, Format, Creator/KOL, Engagement Quality, Audience Fit, Risk Flag และ Recommended Content Direction
8) Trend & Opportunity Intelligence
Emerging Topic, Growth Velocity, Unmet Need, Weak Signal, Opportunity Score, Category White Space และ Early Warning
Global Filters
Brand, Product, Competitor, Audience, Platform, Period, Campaign, Content Type, Language และ Geography เฉพาะเมื่อข้อมูลรองรับอย่างเหมาะสม
11. AI/NLP Intelligence Engine
Functional Components
- Thai/English Language Detection และ Text Normalization
- Entity/Brand/Product Resolution
- Spam, Bot-like และ Duplicate Filtering
- Topic Discovery และ Taxonomy Classification
- Sentiment, Emotion และ Aspect-based Sentiment
- Need, Driver, Barrier, Occasion และ Trigger Extraction
- Audience Clustering และ Affinity Scoring
- Narrative, Risk และ Anomaly Detection
- Campaign/Creative/KOL Attribution Signals
- Evidence-grounded Executive Summary และ Recommendation
AI Governance
- Human validation สำหรับ Taxonomy, High-impact Insight และ Executive Recommendation
- แสดง Evidence Sample และ Confidence ทุก Insight สำคัญ
- Version Model, Prompt, Taxonomy และ Methodology
- ตรวจ Bias, Drift, False Positive/Negative และภาษาเสียดสี/ประชด
- ห้าม Generative AI สร้างตัวเลขหรือข้อสรุปที่ไม่มี Query Result รองรับ
- Recommendation ต้องเชื่อมกับ Evidence, Business Objective และ Owner ที่รับผิดชอบ
12. PDPA, Data Governance และ Ethical Use
การออกแบบต้องยึดหลัก Data Minimization, Purpose Limitation, Security, Retention Control, Transparency และสิทธิของเจ้าของข้อมูล ตามกฎหมายและข้อกำหนดที่เกี่ยวข้อง โดยให้ฝ่ายกฎหมาย/DPO ตรวจฐานกฎหมายและบทบาท Data Controller/Data Processor ของแต่ละโครงการ
Required Controls
- Data Source Register และสิทธิ์การเข้าถึง
- Data Inventory, Classification และ Data Flow
- Purpose และ Lawful Basis Record
- Contract/DPA และ Subprocessor Register
- Pseudonymization และ Aggregate-by-default
- Role-based Access, MFA, Audit Log และ Encryption
- Retention/Deletion Schedule
- Data Subject Request Workflow เมื่อใช้บังคับ
- Incident Response และ Breach Escalation
- DPIA/Risk Assessment สำหรับ Use Case ที่มีความเสี่ยงสูง
- Prohibited-use Policy เช่น Doxxing, Discrimination, Sensitive Profiling และ Individual Targeting ที่ไม่ชอบด้วยกฎหมาย
- Platform Terms และ API Compliance Review
- เอกสารอ้างอิงทางการ: สำนักงานคณะกรรมการคุ้มครองข้อมูลส่วนบุคคล (PDPC)
13. Product Packages
ราคาด้านล่างเป็น โครงสร้างแนะนำสำหรับออกแบบ Commercial Model ต้องคำนวณใหม่ตาม Data Volume, Platform License, จำนวน Brand/Keyword, Historical Data, Analyst Hours, Integration และ SLA ก่อนเสนอราคา
| Package | Essential | Professional | Enterprise |
| เหมาะสำหรับ | 1 Brand/Category | ทีมการตลาดที่ต้องการ Deep Insight | หลาย Brand/BU และองค์กรขนาดใหญ่ |
| Brand Health | ✓ | ✓ | ✓ Custom Index |
| Competitor | 3–5 Brands | 5–10 Brands | Custom |
| Audience Segment | Overview | Advanced | Custom Model |
| Social U&A | —/Add-on | ✓ | ✓ + Hybrid Research |
| Campaign Tracking | Basic/Add-on | 2–4 Campaigns | Portfolio/Always-on |
| Influencer/Content | Basic | Advanced | Custom |
| Risk Intelligence | Alert | Advanced | 24×7/Custom SLA |
| Dashboard | Standard | Advanced | Executive + Multi-BU |
| Report/Consulting | Monthly | Monthly + Quarterly Workshop | Executive Advisory |
| Integration | Export | Export/API Add-on | API, SSO, Data Lake/BI |
Revenue Model
- Platform Subscription: Dashboard, data processing และ standard analytics
- Managed Intelligence Service: Analyst report, insight review และ recommendation
- Research Project: Brand Health, Social U&A, Category Landscape, Campaign Effectiveness, Competitor Audience และ New Product Opportunity
- Integration/Custom Model: API, taxonomy, data lake, custom index และ enterprise deployment
14. SLA Framework
| Service | Essential | Professional | Enterprise |
| Dashboard Refresh | Daily | Daily/near-real-time ตามแหล่งข้อมูล | Custom |
| Monthly Report | ภายใน 7 วันทำการ | ภายใน 5 วันทำการ | Custom calendar |
| Standard Alert | Business hours | Extended hours | 24×7 option |
| Critical Alert Acknowledgement | 4 ชม.ทำการ | 1–2 ชม. | 15–30 นาทีตาม SLA |
| Analyst Support | Email/Meeting | Dedicated analyst | |
| Quarterly Review | Add-on | ✓ | Executive workshop |
| Availability Target | กำหนดในสัญญา | กำหนดในสัญญา | Enterprise SLA |
SLA ต้องแยก Data Availability ของแพลตฟอร์มภายนอก ออกจาก Availability ของระบบ IDA และกำหนด Maintenance, Incident Severity, Escalation, RTO/RPO และ Service Credit ให้ชัดก่อนทำสัญญา
15. Industry Use Cases
FMCG — หา Occasion และ Product White Space
วิเคราะห์ว่ากลุ่มใดใช้สินค้าในเวลา/สถานการณ์ใด ปัจจัยเลือกซื้อคือรสชาติ ราคา สุขภาพ หรือความสะดวก และมี Unmet Need ใดที่คู่แข่งยังไม่ตอบโจทย์ ผลลัพธ์นำไปใช้กับ Product Concept, Pack Size, Message และ Creator Strategy
Retail — เชื่อม Promotion กับ Audience Response
วัด Conversation Lift และ Sentiment ราย Promotion/สาขา/Channel เมื่อข้อมูลรองรับ แยก Deal Seekers, Convenience First และ Experience Seekers เพื่อปรับ Offer, Content และ Service Recovery
Banking — Trust, Digital Experience และ Campaign Effectiveness
วิเคราะห์ Trust Association, App Experience, Service Pain Point, Fraud Concern และปฏิกิริยาต่อ Campaign โดยใช้ Aggregate Insight และหลีกเลี่ยงการสร้างโปรไฟล์การเงินรายบุคคล
Automotive — Consideration Journey และ Switching Signals
ติดตามปัจจัยเลือกซื้อ เช่น ราคา สมรรถนะ EV Range Service Network Resale Value และ Technology พร้อมวิเคราะห์ผู้เปรียบเทียบหลายแบรนด์ Creator Influence และ Launch Association Shift
Telco — Network Experience, Plan Value และ Churn Signals
วิเคราะห์ Complaint Theme, Coverage/Speed Perception, Package Value, Service Experience และ Public Switching Conversation เพื่อกำหนดพื้นที่แก้ไขเร่งด่วนและข้อความรักษาลูกค้า โดยไม่อ้างว่า Public Signal คือ Churn จริงทั้งหมด
16. Deliverables สำหรับลูกค้า
- Audience Intelligence Dashboard
- Executive Monthly Intelligence Report
- Quarterly Brand & Audience Review
- Audience Segment Cards และ Persona
- Brand Health Index Scorecard
- Social U&A Study
- Campaign Pre/During/Post Report
- Competitor Benchmark และ Perception Map
- Trend, Opportunity และ Risk Alert
- Executive Recommendation พร้อม Action Owner และ KPI
- Methodology, Data Coverage และ Limitation Appendix
- Data Governance/Security Documentation ตาม Package
17. Implementation Roadmap
Phase 1 — Discover & Scope (2–4 สัปดาห์)
- กำหนด Business Question, Brand/Category, Audience, Data Source, Benchmark, KPI, Governance และ Success Criteria
Phase 2 — Data & Taxonomy Foundation (4–8 สัปดาห์)
- สร้าง Source Register, Keyword/Entity Model, Topic Taxonomy, Data Quality Rule, Brand Association Framework และ Baseline
Phase 3 — Intelligence Model & Dashboard MVP (6–10 สัปดาห์)
- พัฒนา Brand Health, Audience Segment, Social U&A, Campaign Module, Evidence Explorer และ Executive Overview
Phase 4 — Pilot & Calibration (4–6 สัปดาห์)
- ทดสอบกับ Use Case จริง เปรียบเทียบ Analyst Coding/Survey/Business Data ปรับ Accuracy, Weight, Threshold และ Recommendation
Phase 5 — Production & Managed Service
- เปิดใช้งาน Dashboard, Alert, Report, Workshop, Access Control, SLA, Model Monitoring และ Improvement Cycle
18. Success Metrics ของผลิตภัณฑ์
Data & Model
Coverage, Precision/Recall ของ Classification, Unknown Rate, Duplicate/Spam Rate, Freshness, Confidence และ Drift
User Adoption
Active Users, Dashboard Usage, Insight Export, Report Readership, Workshop Adoption และ Time-to-Insight
Decision Impact
จำนวน Recommendation ที่ถูกนำไปใช้, Time-to-Decision, Campaign Optimization, Issue Resolution, New Opportunity Tested และ Stakeholder Satisfaction
Business Outcome
ให้เชื่อมกับ KPI ลูกค้าเท่าที่พิสูจน์ได้ เช่น Consideration, Conversion, Retention, Cost Efficiency, Revenue/Margin หรือ Risk Reduction โดยแยก Correlation ออกจาก Causal Impact
19. Sales Narrative
องค์กรไม่ได้ขาดข้อมูล แต่ขาดความสามารถในการเชื่อมข้อมูลจำนวนมากเข้ากับคำถามว่า ลูกค้าคือใคร แบรนด์อยู่ตรงไหนในใจพวกเขา อะไรเป็นแรงผลักหรืออุปสรรค และกิจกรรมการตลาดสร้างการเปลี่ยนแปลงจริงหรือไม่
IDA Audience Intelligence จึงไม่ได้ส่งมอบเพียง Dashboard แต่ส่งมอบระบบข่าวกรองที่เชื่อม:
Social Signals → Audience Understanding → Brand & Campaign Intelligence → Executive Recommendation → Measurable Action
Call to Action
เริ่มต้นด้วย Audience Intelligence Discovery Workshop เพื่อกำหนด Business Question, Data Coverage, Brand Health Model, Audience Segment และ Campaign Measurement ที่เหมาะกับองค์กร ก่อนพัฒนา Pilot Dashboard และขยายสู่ Always-on Intelligence Service
20. Corporate value
Transforming Data into Trusted Intelligence for Executive Decision-Making
เปลี่ยนข้อมูลให้เป็นข่าวกรองที่เชื่อถือได้ เพื่อการตัดสินใจของผู้บริหาร
Audience Intelligence คือการยกระดับ Social Listening จากการติดตามว่า “เกิดอะไรขึ้น” ไปสู่การทำความเข้าใจว่า “เกิดกับใคร เพราะอะไร และแบรนด์ควรทำอะไรต่อ” โดย IDA Audience Intelligence วิเคราะห์ข้อมูล Social Media และ Digital Signals เพื่อเชื่อมโยง Audience, Brand Health, Consumer Behavior, Competitor และ Campaign Intelligence
เกี่ยวกับผู้จัดทำ
อาจารย์ปรเมศร์ เพียรสกุล ผู้เชี่ยวชาญด้านความมั่นคงปลอดภัยไซเบอร์ (Cybersecurity) ปัญญาประดิษฐ์ (AI) และ Data Intelligence ปัจจุบันดำรงตำแหน่งประธานเจ้าหน้าที่บริหาร (CEO) และผู้ก่อตั้ง บริษัท อินเทลลิเจนท์ ดาต้า อนาไลติก จำกัด